

You’re totally overwhelmed by QuickBooks Online (QBO). But guess what? You’re already doing the right thing. Asking questions about how to use it means you’ve made the good decision to move to cloud accounting.
In this and coming articles, we will be discussing some of our favorite features in QBO and share some helpful tips for QBO users to maximize their use of this platform. The first feature we want to discuss is the QBO Dashboard.
Log in to get started
When you log into your QBO account, the first screen you will see is your dashboard. The dashboard contains everything you need to get things done and get an overview of how your business is performing.
The dashboard is made up of two main tabs:
- Get things done
- Business overview
Let’s discuss these two tabs in more detail.
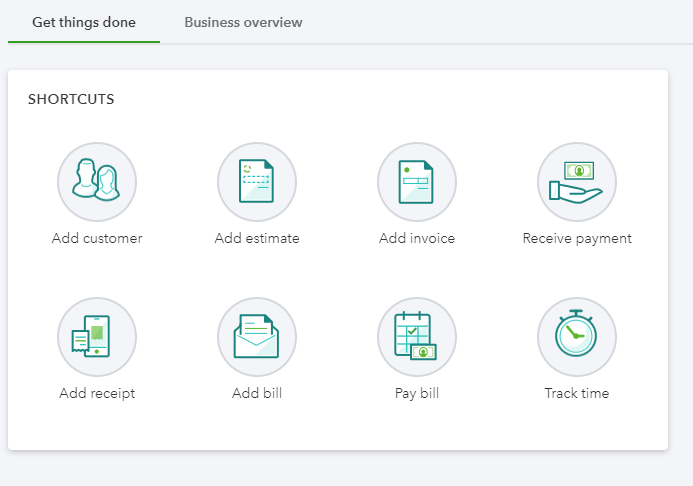
Get things done (literally)
Within the Get things done tab, you will find shortcuts to access many of the common tasks you run in QBO every day. Instead of navigating through the various menu options, you can use these shortcuts to add new transactions.
Use the Business overview to view your business story now
We consider this tab to be the most powerful aspect of the QBO Dashboard. Within the Business overview, you can see many powerful performance indicators of your business in a visually appealing display. If you struggle to understand your business story with your financial reports, the Business overview will definitely be a helpful feature for you.
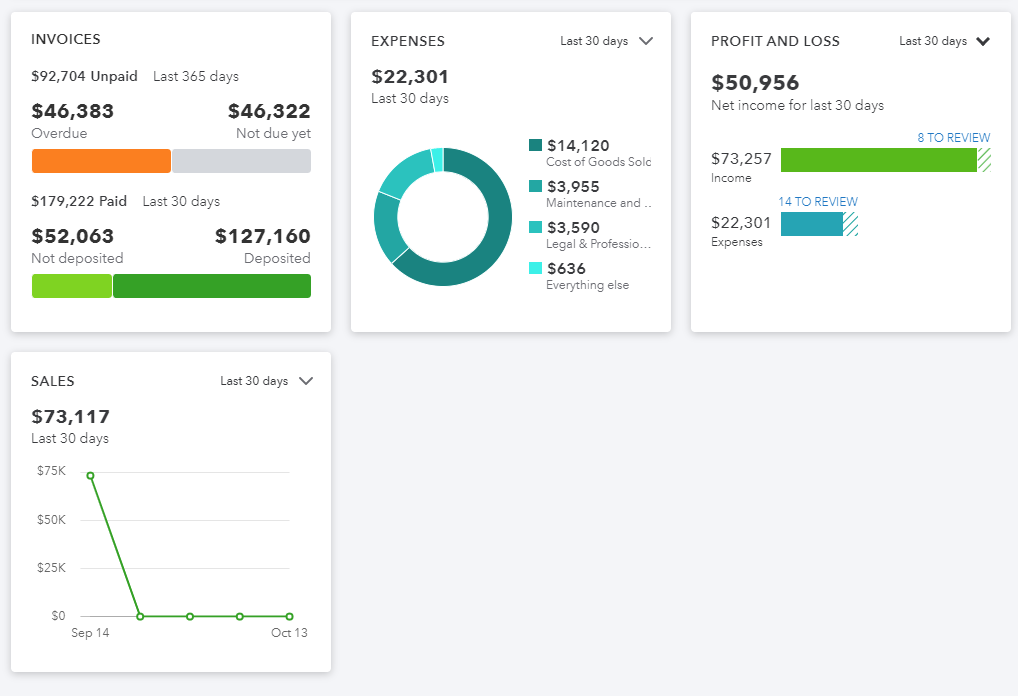
By default, QBO supplies information on the following metrics:
- Invoices
- Expenses
- Profit and Loss
- Sales
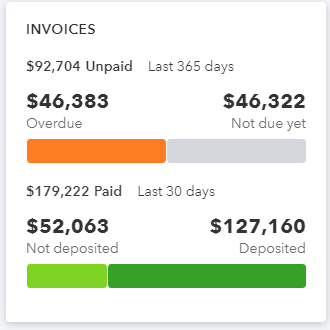
Each section provides a wealth of information. For instance, within the Invoices section, you can see the total amount of overdue invoices compared to those not due yet. You can even see how much of your paid invoices have been deposited to the bank. All of that vital information is packed in this one section!
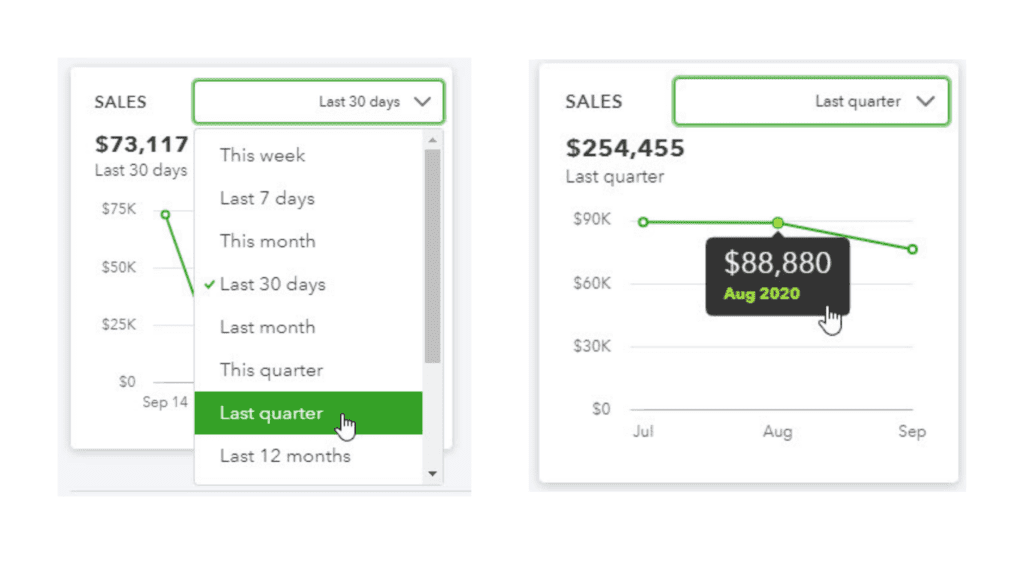
Specific sections within the Business overview can also be manipulated. For instance, suppose you wanted to view your sales data for the previous quarter, instead of the Last 30 days. Simply select the arrow in the upper right corner of the Sales section to select a different period. There are several default filters to choose from. By selecting Last quarter, the Sales graph will update automatically. As you hover over each data point, QBO will supply you with a subtotal from each month within the quarter.
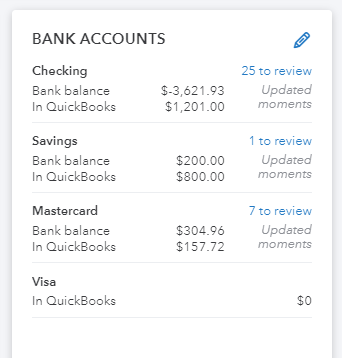
View Bank balances in one central place
Both tabs on the dashboard provide easy access to your banking information. All active bank accounts are listed on the far right of the screen. Each account listed will display the Bank balance as well as the balance In QuickBooks. This screen will also display if any imported transactions from the bank feed are ready for review.
The QBO Dashboard provides one spot to launch most new transactions and also monitors your business performance. With features like these built right into the software, business owners are one step closer to understanding the story of their business.
Are you a small business owner using QBO and seeking to understand the story your business numbers are telling you? Our clients have told us that they started to really understand their business story only after they began their journey with us. If you want to be able to understand your business story, contact us to get started!